Edited on August 24, 2019.
Our classification model is ambitious; we felt that it was important to try to classify all of the eggs of the nine most common parasitic worms which cause neglected tropical disease. This has resulted in a 10-class classification model (nine egg-types plus the negative class). Currently, our dataset is composed of nearly 3000 images, of which some contain multiple parasite eggs. After some preprocessing, we ended up with 4399 cropped images distributed amongst the different classes shown below.
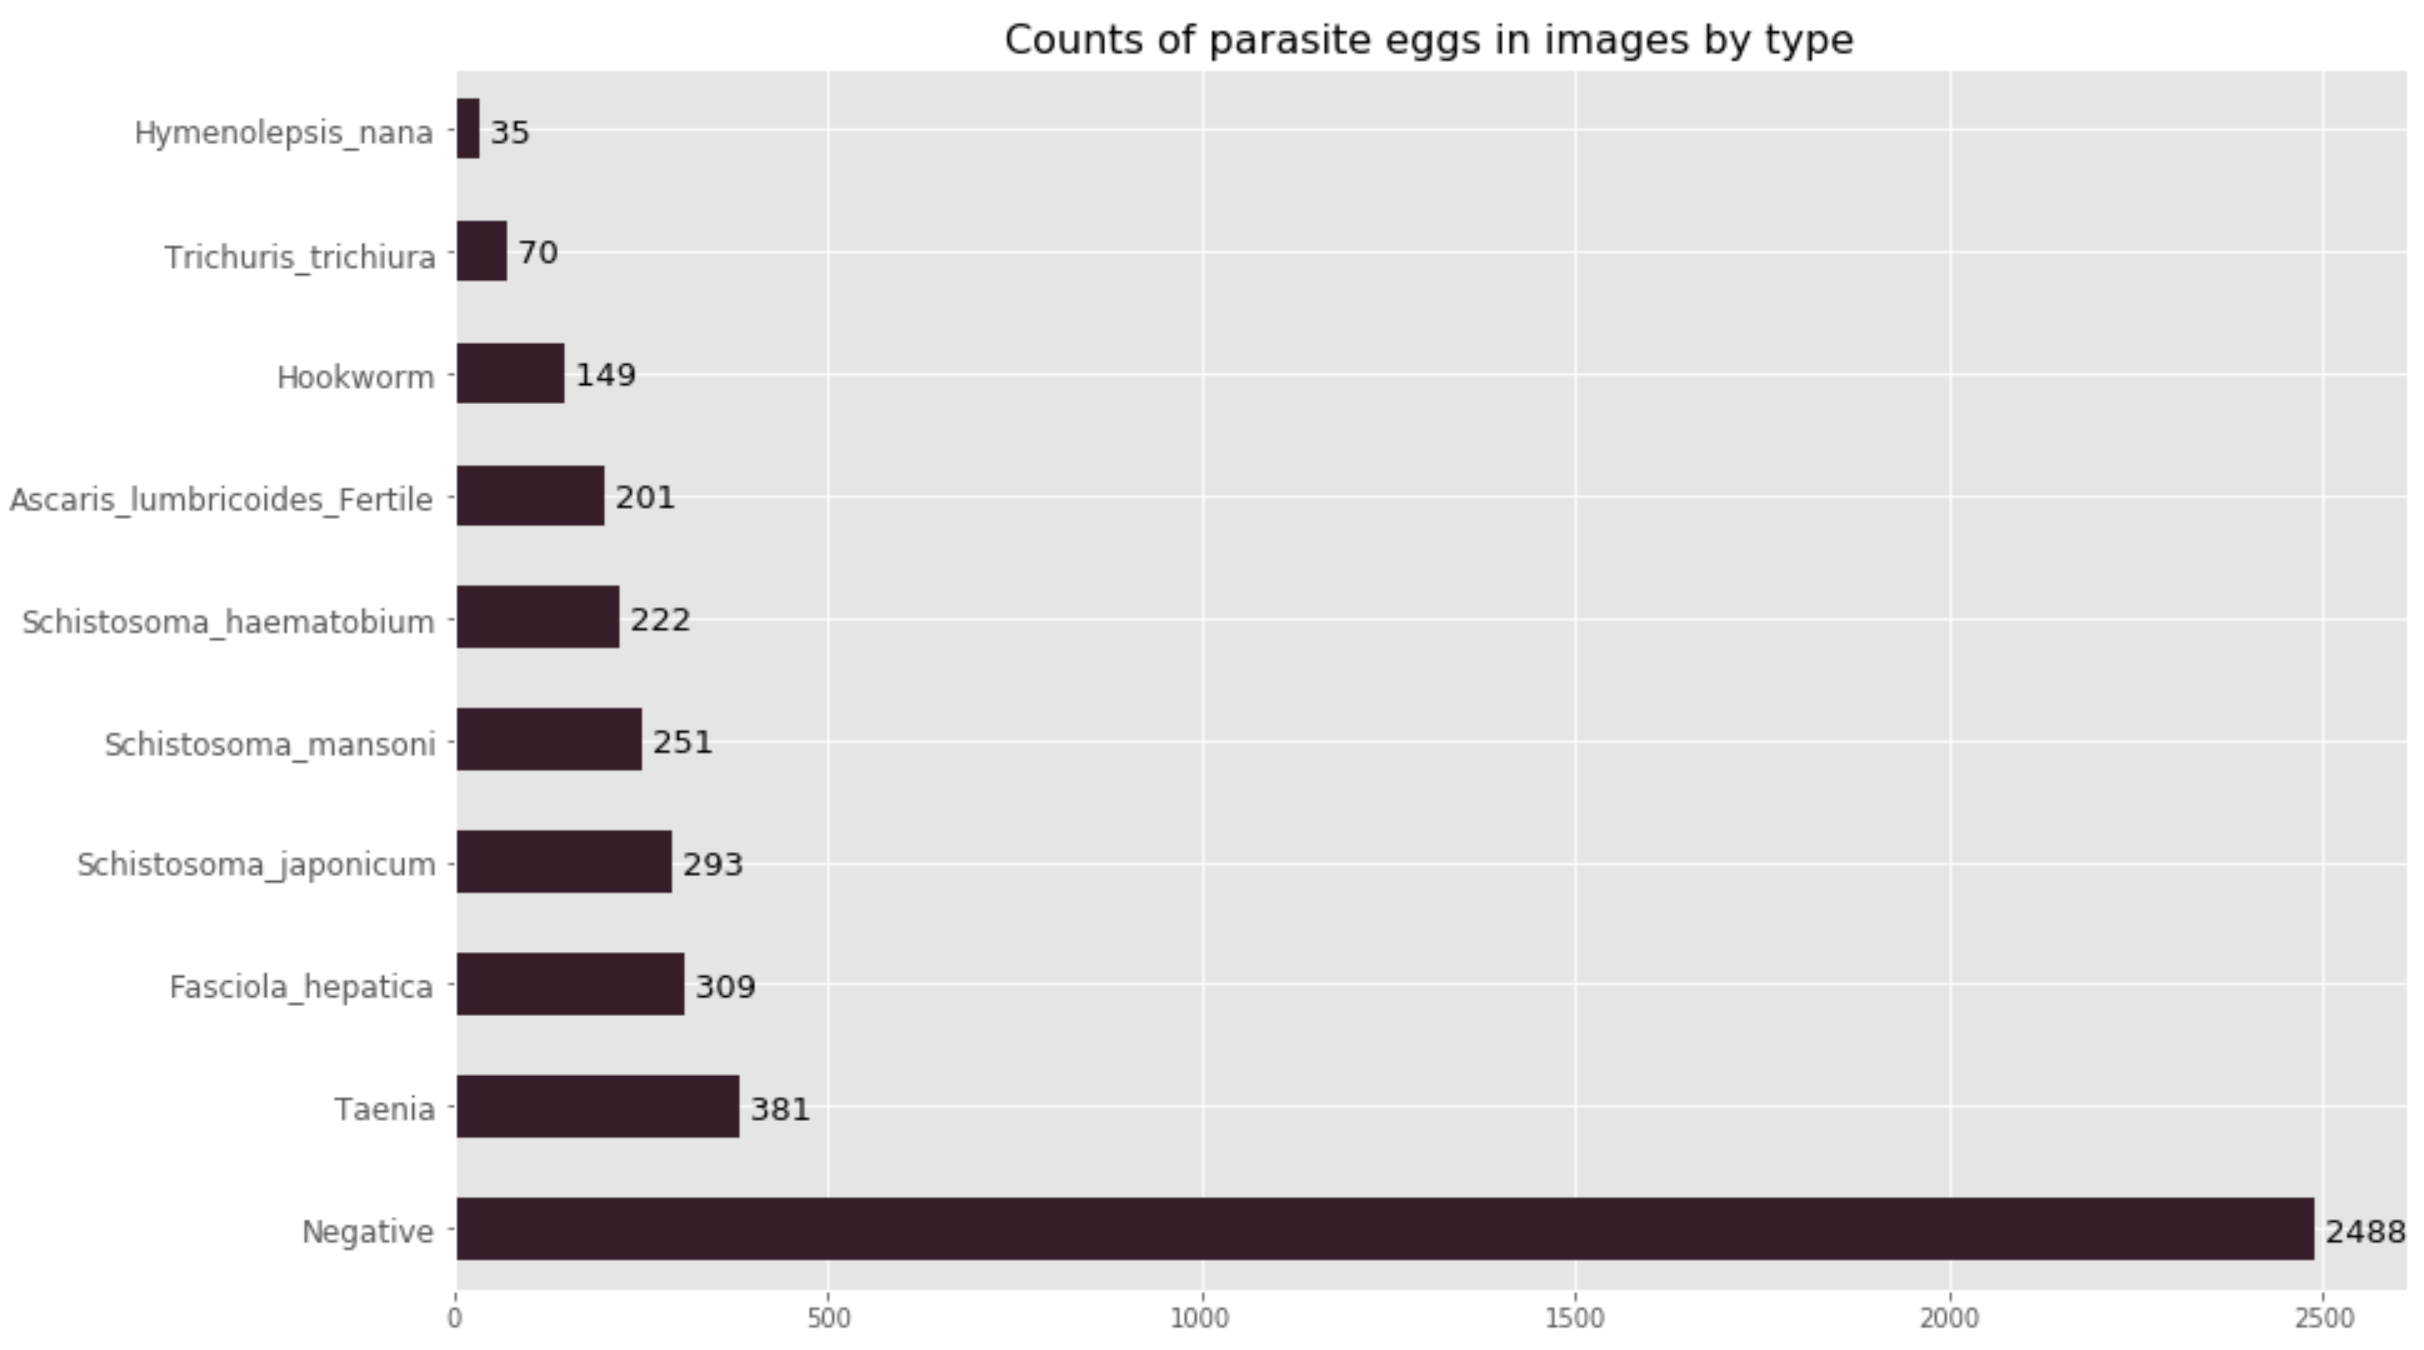
As you will notice, our data is highly imbalanced; we have more images of the negative class than of all 9 parasite egg classes put together. As a result, model evaluation is very important in order to determine how well our model performs for each individual class, as well as on the heldout test set as a whole (880 images).
The first step for sound evaluation of a machine-learning model is to understand the specific type of model to be evaluated. In our case, this is a multiclass classification model (not to be confused with a multi-label classification or hierarchical classification model).
All the evaluation metrics for a multiclass classification model can be understood in the context of a binary classification model (where the classes are simply “positive” and “negative”). These metrics are derived from the following four categories:
-
True Positives (
TP): Items where the true label ispositiveand whose class is correctly predicted to bepositive. -
False Positives (
FP): Items where the true label isnegativeand whose class is incorrectly predicted to bepositive. -
True Negatives (
TN): Items where the true label isnegativeand whose class is correctly predicted to benegative. -
False Negatives (
FN): Items where the true label ispositiveand whose class is incorrectly predicted to benegative.
We can understand a multiclass classification problem as a set of many binary classification problems—one for each class. For example, in the case of our classifier, when considering the parasite egg class “Hookworm”, a true positive occurs when an actual hookworm egg is predicted to be a hookworm egg. Any other prediction—whether it be “no egg” or another parasite—will be considered a false negative. This is true for every single class: what we call “positive” and “negative” will change depending on the true label of the object. This means that there are multiple classes which are considered true negatives for a given prediction.1 (For example, if we are considering the class Schistosoma mansoni, a true S. mansoni must be identified as S. mansoni to be a true positive. However, if we are considering the class of S. japonicum, then the original S. mansoni could be labeled as S. mansoni, Hookworm, “no egg”, or anything else as long as it isn’t S. japonicum and it will still be a true negative for the class S. japonicum.) In our case, we are also seeking to correctly classify an image containing no parasite egg, so the label “Negative”—or “no egg”—is its own class, and we call it a true positive when an image with no egg is successfully classified as such.
In this context, let’s review the common evaluation metrics for machine-learning classification models, and discuss how they relate to the particular problem we’re trying to address.
-
Accuracy: Number of items correctly identified as either truly positive or truly negative out of the total number of items —
(TP+TN)/(TP+TN+FP+FN) -
Recall (also called Sensitivity or True Positive Rate): Number of items correctly identified as positive out of the total actual positives —
TP/(TP+FN) -
Precision (Positive Predictive Value): Number of items correctly identified as positive out of the total items identified as positive —
TP/(TP+FP). -
F1-Score: The harmonic average of the precision and recall, it measures the effectiveness of identification when just as much importance is given to recall as to precision —
(2 * precision * recall) / (precision + recall) -
Specificity (True Negative Rate): Number of items correctly identified as negative out of the total actual negatives —
TN/(TN+FP) -
False Positive Rate, or Type I Error: Number of items wrongly identified as positive out of the total actual negatives —
FP/(FP+TN). This error means that an image not containing a particular parasite egg is incorrectly labeled as having it. Although this could translate into an individual who is not suffering from a specific worm infection (say, Fasciola hepatica) inappropriately getting prescribed a certain drug (like Bithionol, in this case), this type of error is not largely consequential for an individual egg-type. This stems from the fact that, in general, antiparasitic drugs have a low risk of only mild side effects for someone who is not infected. -
False Negative Rate, or Type II Error: Number of items wrongly identified as negative out of the total actual positives —
FN/(FN+TP). This metric is especially important to us, as it tells us the frequency with which a particular parasite egg is not classified correctly. Because our model is intended to be a diagnostic aid, we want this metric to be as low as possible, because otherwise it would mean that an individual suffering from a particular parasitic infection would go either undiagnosed or misdiagnosed. In both cases, it would mean that the patient does not receive the drug they need in order to get better.2
There is nuance to the above, however, because some of the infections caused by different parasites are actually treated with the same drugs. From a modeling perspective, we aim to reduce all error and increase performance in all evaluation metrics, but from the perspective of this model being used as a medical diagnostic aid, error doesn’t matter as much if a patient infected with parasite A is incorrectly identified as being infected with parasite B in the case where infections by parasites A and B are treated with the same medicine anyway.
For this type of scenario, a confusion matrix helps us understand which parasite eggs are being mistaken for another egg-type, so we can consider the implications from both a modeling perspective and a medical treatment perspective. We obtained our metrics for evaluation by running a test set of 880 images through our VGG16 Transfer Learning Classification Model. The results are displayed in the confusion matrix below.
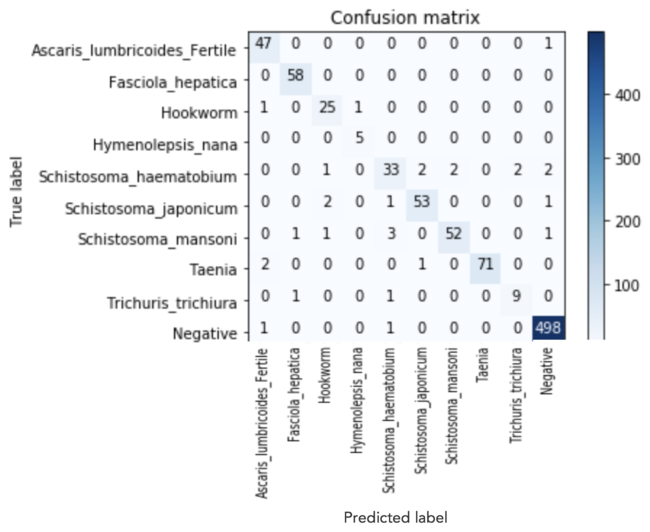
As you can see, we had relatively few errors. For 10 of the 24 cases where one parasite egg was misclassified as another parasite egg, those two parasitic infections are conveniently treated with the same drug.
Now, let’s dive in to the details of multiclass clasification evaluation. We have to be careful here because accuracy with a binary classifier is measured as (TP+TN)/(TP+TN+FP+FN), but accuracy for a multiclass classifier is calculated as the average accuracy per class. For calculating the accuracy within a class, we use the total 880 test images as the denominator. This gives us a sense of how effective the classifier is at the per-class level.
Other metrics—precision, recall, and F1-score, specifically—can be calculated in two ways with a multiclass classifier: at the macro-level and at the micro-level. Macro-level metrics give equal weight to each class—e.g., recall for Hymenolepsis nana (our class with the least number of observations) is weighted the same as recall within our “no egg” class in order to determine the marco-level recall score over the entire test data set. Micro-level evaluation metrics, on the other hand, weight all items equally. This means that classes with more observations will have more influence in the metric. The table below shows how the metrics are calculated.3
Note: In the formulas below, k = total number of classes; μ and M indices represent micro- and macro-averaging, respectively.
| Metric | Formula | Evaluation focus |
|---|---|---|
| Average Accuracy | The average per-class effectiveness of the classifier | |
| Error Rate | The average per-class classification error | |
| Precisionμ | Agreement of the true class labels with those of the classifier’s, calculated by summing all TPs and and FPs in the system, across all classes | |
| Recallμ | Effectiveness of a classifier to identify class labels, calculated by summing all TPs and and FNs in the system, across all classes | |
| F1-scoreμ | The harmonic mean of the micro-average precision and recall | |
| PrecisionM | Average per-class agreement of the true class labels with those of the classifier’s | |
| RecallM | Average per-class effectiveness of a classifier to identify class labels | |
| F1-scoreM | The harmonic mean of the macro-average precision and recall |
After applying these formulas to our test results, we arrived at the evaluation metrics shown in the table below. Also included in the table are per-class metrics, so you can see how accuracy and other metrics vary according to class. The classes are listed in order from least to greatest number of observations in our entire dataset.
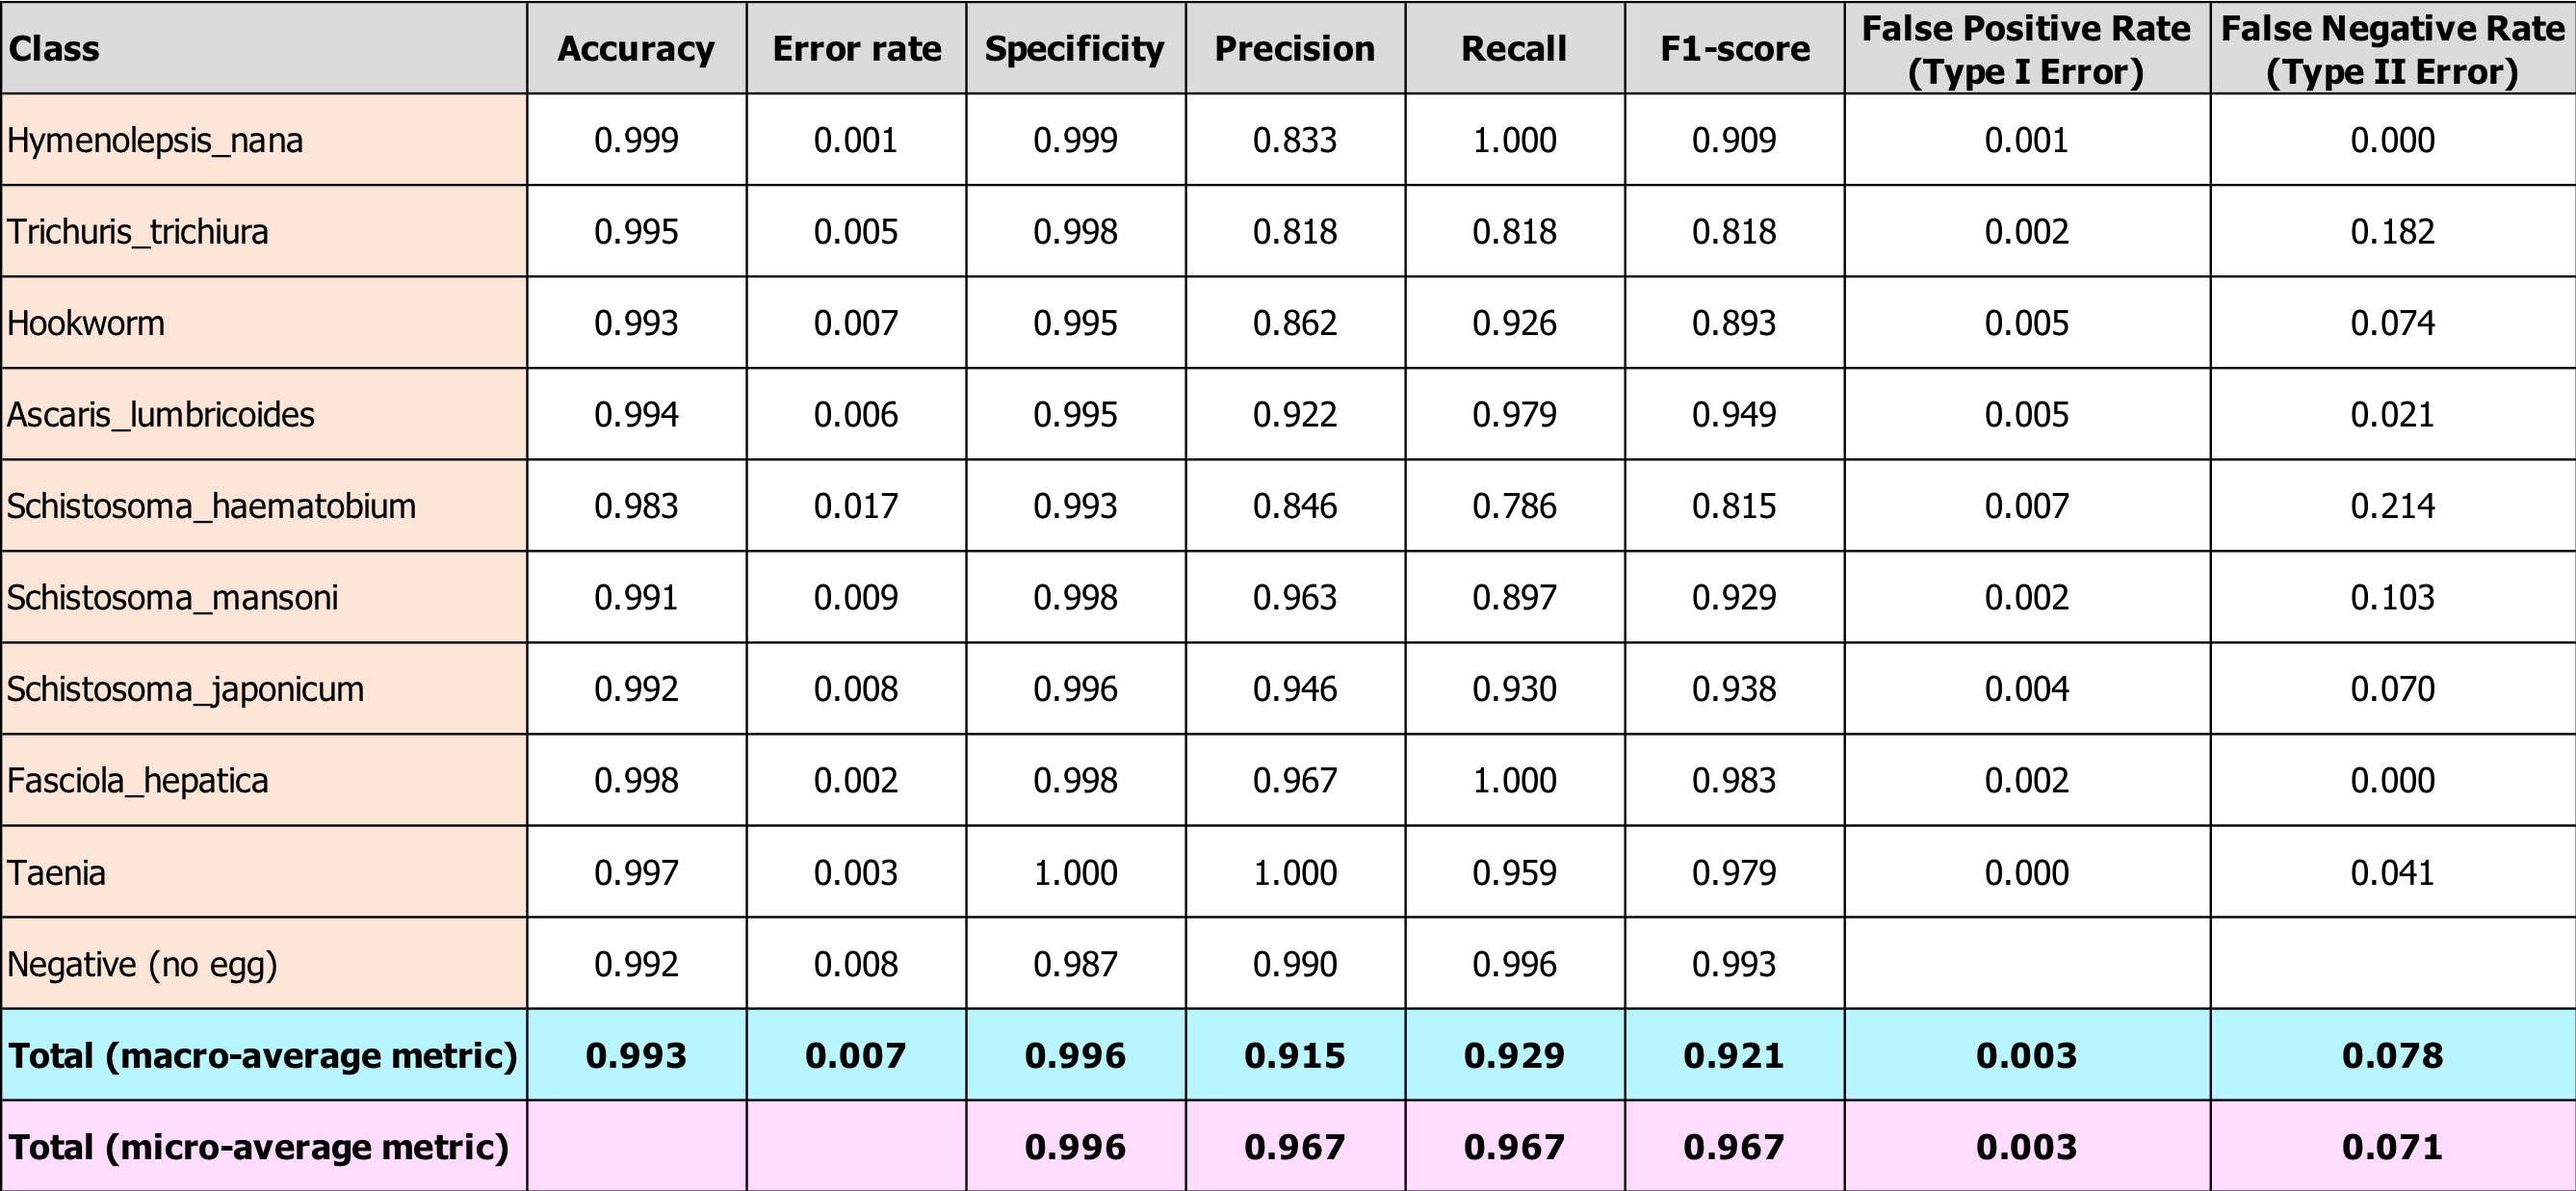
Our metrics are quite good, especially given our relatively small training set spread across 10 classes. Accuracy is high across all egg-types, but recall is not as high as we would like it be for all types (particular for S. haematobium). Our Type II error rate is also higher than we would like. Again, from a medical treatment perspective, this error rate is inflated since some of these false negatives mean the patient would be treated for a different parasitic worm infection, but with the drug they need anyway.
Finally, you can see in the bottom two rows that the macro-level metrics are lower than the micro-level metrics for precision, recall, and F1-score. This means that our smaller classes are performing more poorly, as we anticipated. This indicates that, in order to improve our model, we should collect more images from our least-represented classes. Please get in touch with us if you have any to share!
1) Apache Spark, Evaluation Metrics - RDD-based API, 2018. https://spark.apache.org/docs/latest/mllib-evaluation-metrics.html. ↩
2) A. Swalin, Choosing the Right Metric for Evaluating Machine Learning Models — Part 2, May 2018. https://medium.com/usf-msds/choosing-the-right-metric-for-evaluating-machine-learning-models-part-2-86d5649a5428. ↩
3) M. Sokolova and G. Lapalme, “A systematic analysis of performance measures for classification tasks”, Information Processing and Management, vol 45, pp. 427–437, 2009. http://rali.iro.umontreal.ca/rali/sites/default/files/publis/SokolovaLapalme-JIPM09.pdf. ↩